How Energy Transmission Can Be Optimized for a Future of Solar Power
By Julia Somlo and Kevin Chen
As 2025 approaches an end, questions may be raised about the future of the environment: will sea levels rise even more than last year? According to recent reports, sea levels have risen nearly 10.1 centimeters since 1993. Sea level rise is just one of the many environmental issues that have arisen from emission of greenhouse gases, which accumulate in the atmosphere. Some of the most prominent greenhouse gases in the atmosphere are carbon dioxide, or , and methane, or .
Since 1951, levels of in the atmosphere have risen from 315.71 to 429.61 parts per million and levels of in the atmosphere have risen from 1625.96 to 1935.33 parts per billion. The burning of fossil fuels caused this trend; as of 2024, non-renewable fuels made up 86 percent of all global energy consumed, leaving under 14% of energy to renewable energy. Despite current dependence on fossil fuels, oil is predicted to run out in 54 years and natural gas following close behind. Therefore, in future years, much larger amounts of renewable energy must be consumed.
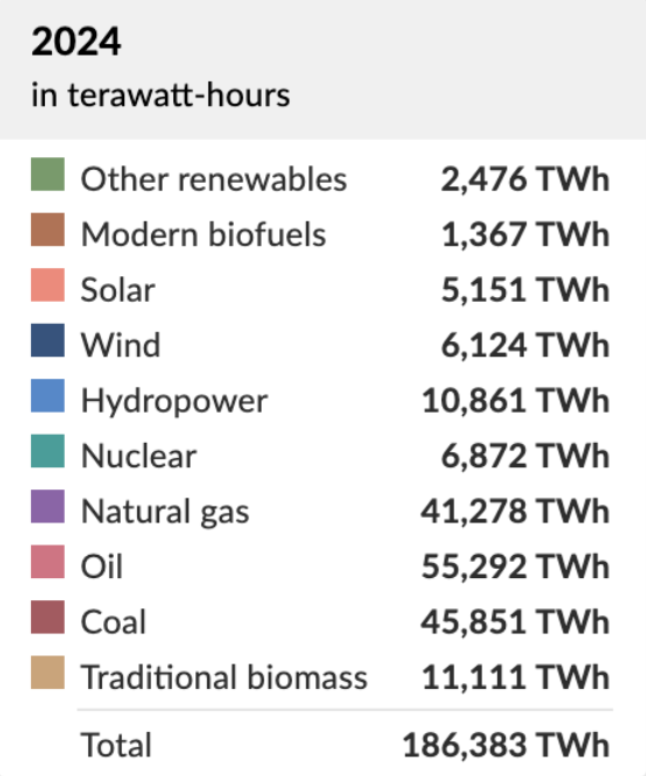
This table shows yearly consumption of different types of energy, in terawatt hours. According to this chart, the 5 most consumed power sources in 2024 were oil, coal, natural gas, traditional biomass energy, and hydropower. While hydropower almost consumed the same amount of energy as traditional biomass, median sustainable energy consumption still lags roughly 26,000 terawatt hours behind median traditional energy.
Due to a lack of frequent availability of resources and technological hurdles that constrain the amount of renewable energy that can be consumed, such as deprivation of optimal amounts of solar radiation, renewable energy is not always transmissible. Due to such conditions, new technology is required to produce and transmit sustainable energy. One promising technology, solar power, is generated by light hitting special panels that can generate electricity after photons, or light particles emitted from the sun, hit them. The amount of energy that is emitted from the sun in just over an hour could power the entire planet. Nevertheless, in 2024, only 19% of renewable energy consumed in 2024 was solar power, which is much lower than the amount of energy that could be collected by solar panels. When a large amount of photons hit photovoltaic panels, electrons in the silicon material travel to and then around the edge of the panel, and then into wires, which connect all panels to an inverter, which converts the generated DC electricity, which is used by most wireless devices via batteries, or direct current electricity into AC electricity, which transmits much more efficiently and is used in most household appliances.
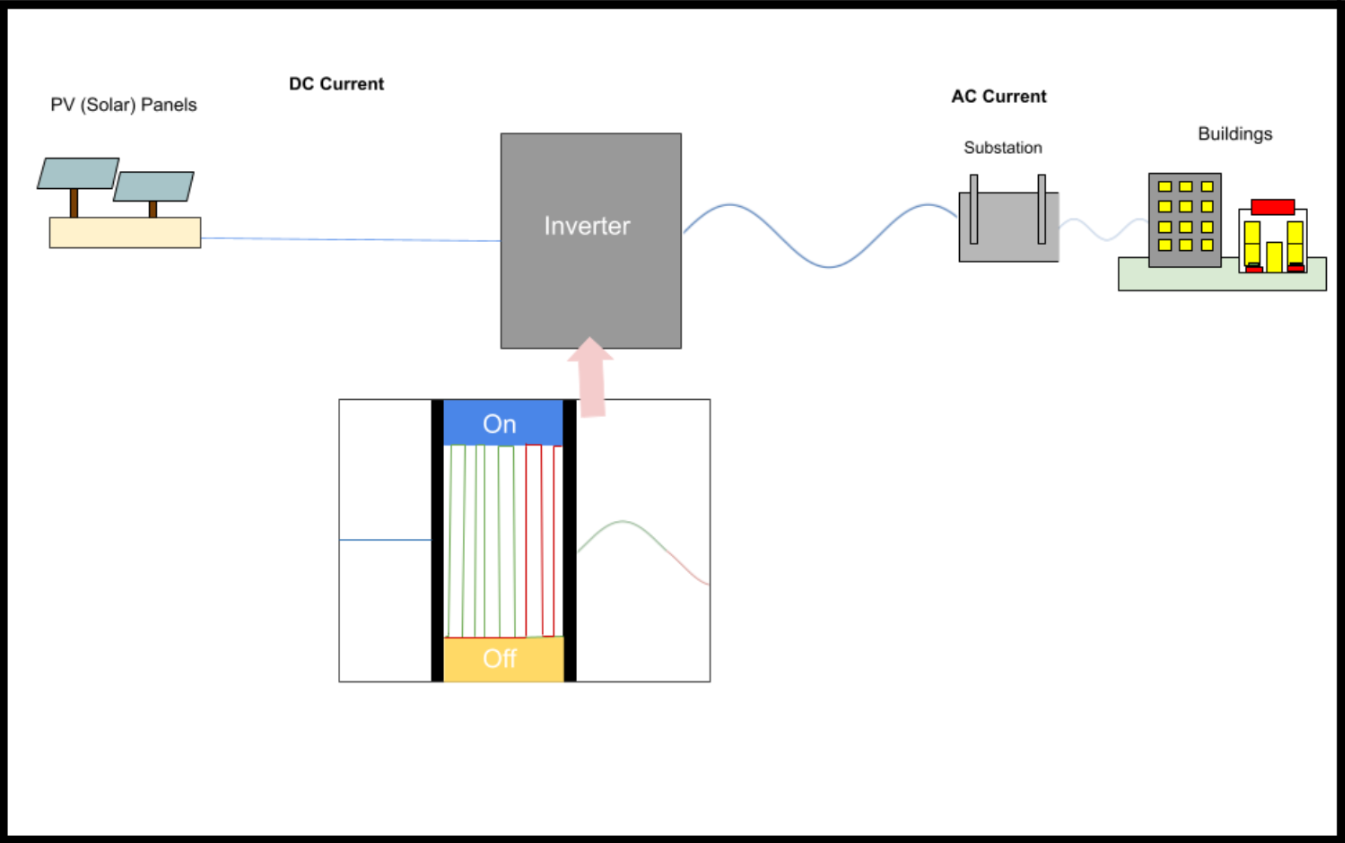
However, current inverters, which are used to convert this energy, lose large amounts of energy due to harmonic frequencies, which are distorted frequencies that result from the conversion of DC to AC current electricity. Due to this, major functional disruptions, including a significant decrease in voltage that reduces inverters’ efficiency, leading to less energy output and eventual reduced efficiency, may occur. In some cases, disruptions cause overheating, which contributes to electrical fires. To prevent functional disruption from harmonic wavelengths, IoT, or Internet of Things, is a technology that connects sensors on objects to the internet, and can connect sensors installed on inverters, and measure metrics such as power output. However, constant human monitoring of these statistics is extremely economically inefficient for energy companies. One strategy that eliminates harmonic signals is Fourier analysis, which is used to break down electrical signals into fundamental, or necessary and harmonic, or problematic components, essentially distinguishing harmonic signals from necessary signals. Current IoT may allow for cloud storage of information, which can optimize the speed of information transmission.
To analyze harmonic distortion more precisely, inverter output can be modeled mathematically as a time-dependent signal. Let represent the voltage output of an inverter at time . In an ideal case, this signal would closely resemble a pure sinusoidal waveform, where is the amplitude of the signal and is the angular frequency, corresponding to the standard grid frequency (60 Hz in the United States).
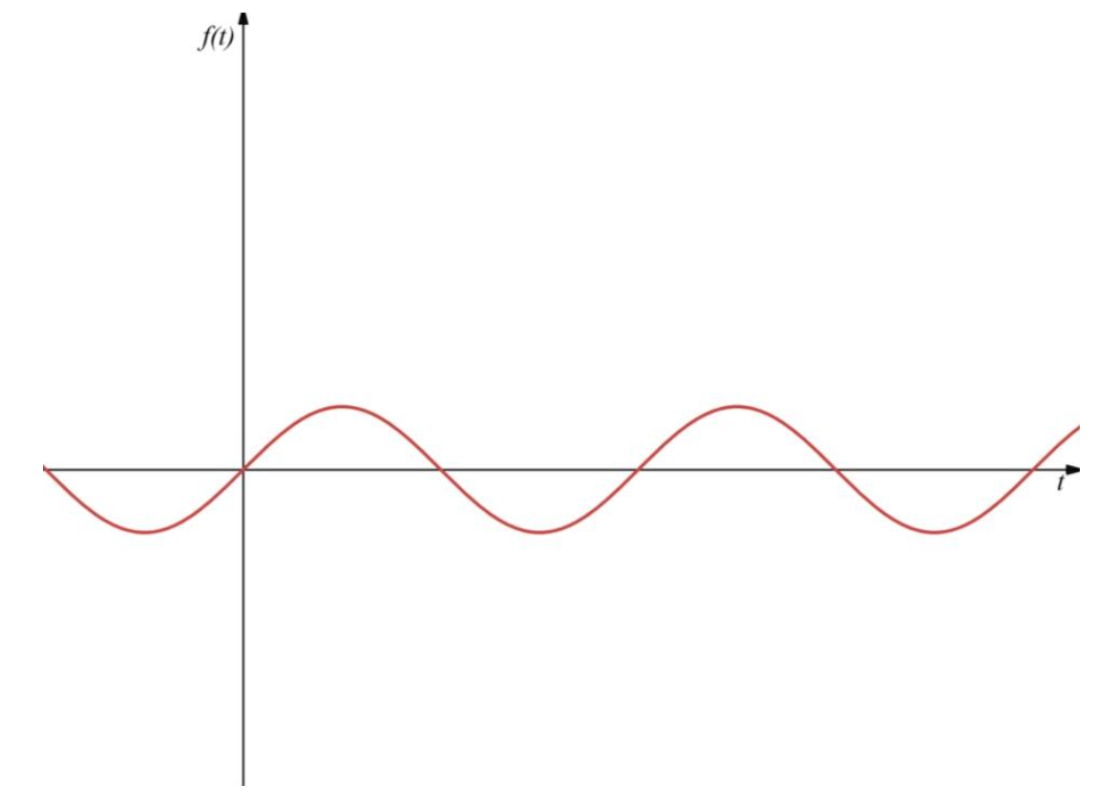
In practice, however, inverter outputs are rarely perfect. They often contain harmonics, which are additional sinusoidal components whose frequencies are integer multiples of the fundamental frequency. A more realistic representation of the signal is therefore where and represent the amplitude and phase shift of the th harmonic. These higher-frequency components distort the waveform and reduce overall power quality, which can lead to inefficiencies and equipment stress.
Moreover, Fourier analysis provides a natural way to identify and separate these harmonic components. The Fourier transform of a signal , defined as is a mathematical operation that decomposes the signal into a collection of sinusoidal waves at different frequencies, each with a specific amplitude and phase. This transformation converts the signal from the time domain, where voltage is described as it changes over time, into the frequency domain, where the signal is described by how much of each frequency it contains. In the frequency spectrum, harmonic distortion appears as peaks at integer multiples of the fundamental frequency.
In real-world inverter systems, signals are sampled digitally, so Fourier analysis is typically implemented using the Discrete Fourier Transform (DFT) or the Fast Fourier Transform (FFT). The DFT directly computes the frequency components of a discrete signal, while the FFT is an optimized algorithm that computes the same result more efficiently, methods that both allow harmonic content to be detected efficiently and in near real time.
Although Fourier analysis is effective at identifying frequency components, real photovoltaic data is often noisy and influenced by changing environmental conditions such as weather, shading, and electrical load fluctuations. To improve detection reliability, Fourier-based methods can be combined with Artificial Neural Networks (ANNs).
After transforming an inverter signal into the frequency domain, the resulting Fourier coefficients can be used as input features for a neural network. An ANN can be expressed mathematically as where represents the input features provided to the network (in this case, frequency-based), and are the weights and biases that determine how strongly different inputs influence outputs of the network, and is a nonlinear activation function for better adjustment. By training the network on labeled data, it can learn to distinguish between normal inverter signals and those affected by harmonic distortion.
Fourier analysis is already used to find harmonic components of signals, however, now that ANNs are much more widespread, this method will most likely be used much more in the future to find and reduce harmonic components in the future.
When integrated with IoT-based monitoring systems, this approach allows potential issues to be identified early and addressed before they cause larger disruptions. As renewable energy continues to grow, mathematical tools like these will play an important role in maintaining efficient and reliable power systems.
References
European Commission. (n.d.). Causes of climate change. EU Climate Action. https://climate.ec.europa.eu/climate-change/causes-climate-change_en
IBM. (n.d.). What is a neural network? https://www.ibm.com/think/topics/neural-networks
IEEE Internet of Things Journal. (n.d.). IEEE Internet of Things Journal. https://ieee-iotj.org/
Lee, J. J. (2025, March 13). NASA analysis shows unexpected amount of sea level rise in 2024. NASA Sea Level Change Portal. https://sealevel.nasa.gov/news/282/nasa-analysis-shows-unexpected-amount-of-sea-level-rise-in-2024/
MIT OpenCourseWare. (n.d.). Signals and systems. https://ocw.mit.edu/courses/6-003-signals-and-systems-fall-2011/
NASA. (2025, September 25). Carbon dioxide – Earth indicator. NASA Science. https://science.nasa.gov/earth/explore/earth-indicators/carbon-dioxide/
NASA. (2025, September 25). Methane – Earth indicator. NASA Science. https://science.nasa.gov/earth/explore/earth-indicators/methane/
Ritchie, H., Rosado, P., & Roser, M. (2020). Energy production and consumption. Our World in Data. Archived November 25, 2025, at https://archive.ourworldindata.org/20251125-173858/energy-production-consumption.html
UCAR Center for Science Education. (n.d.). Types of energy from the sun. https://scied.ucar.edu/learning-zone/earth-system/types-of-energy
U.S. Department of Energy. (n.d.). Grid modernization and the smart grid. https://www.energy.gov/oe/grid-modernization-and-smart-grid